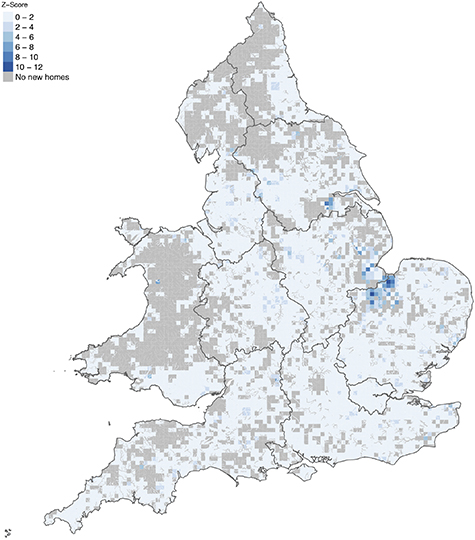
Figure 4. Spatial clusters (hot spots) with high shares of new build homes in high/medium flood risk (HFR; $gt$1%) areas, 2008–2018. High positive Z-score values indicate hot-spots with a high number of neighbouring impact areas with a high share of new build homes in flood zones.